

Our team of BI and development experts worked hand in hand with Pullman Florida to understand their specific needs and strategic objectives. Leveraging our expertise in Power BI and the power of SQL Server, we created a dynamic and visually impactful dashboard that brought together key data from various sources and presented it in a coherent and understandable manner.
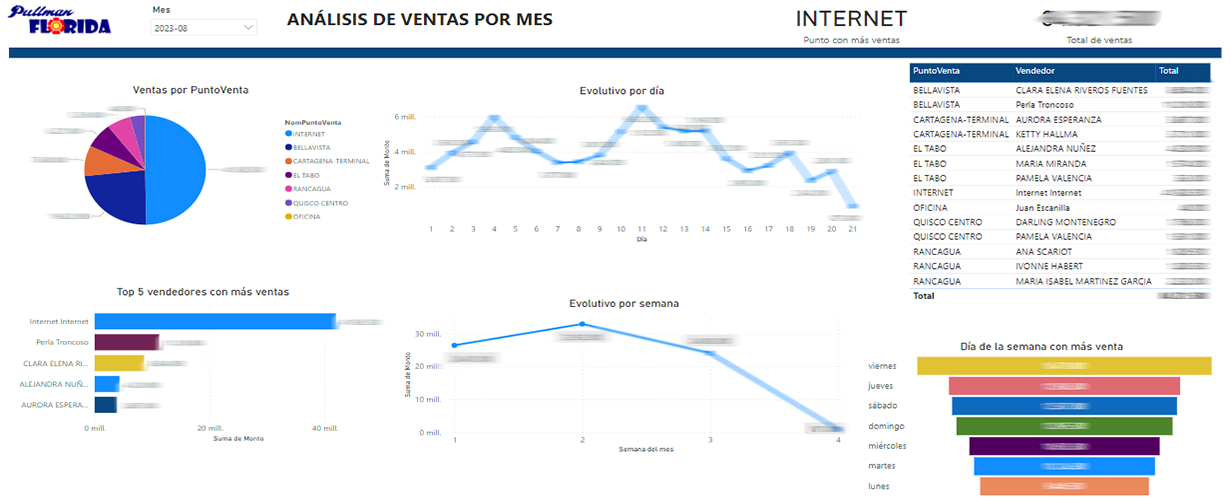
From operational metrics to historical trends, each piece of data came to life, providing Pullman Florida with a clearer and deeper insight into their business.
- Client : Pullman Florida
- Project Date 01/08/2023
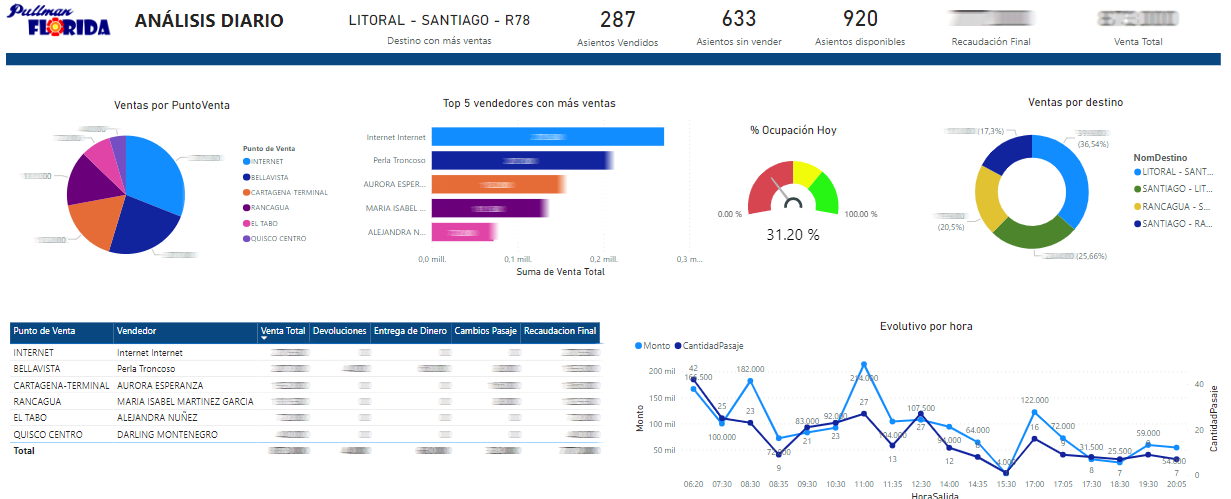
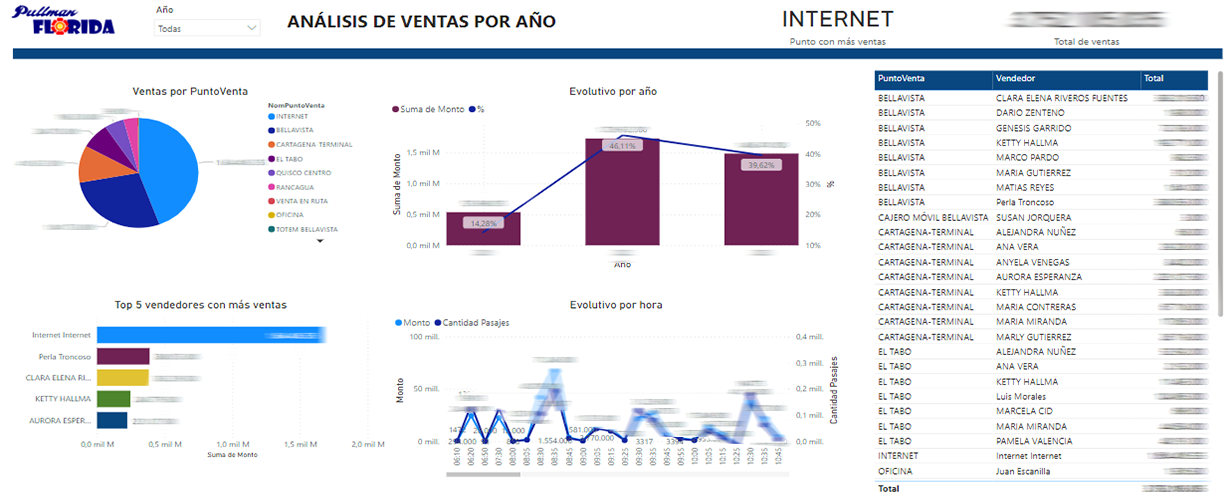
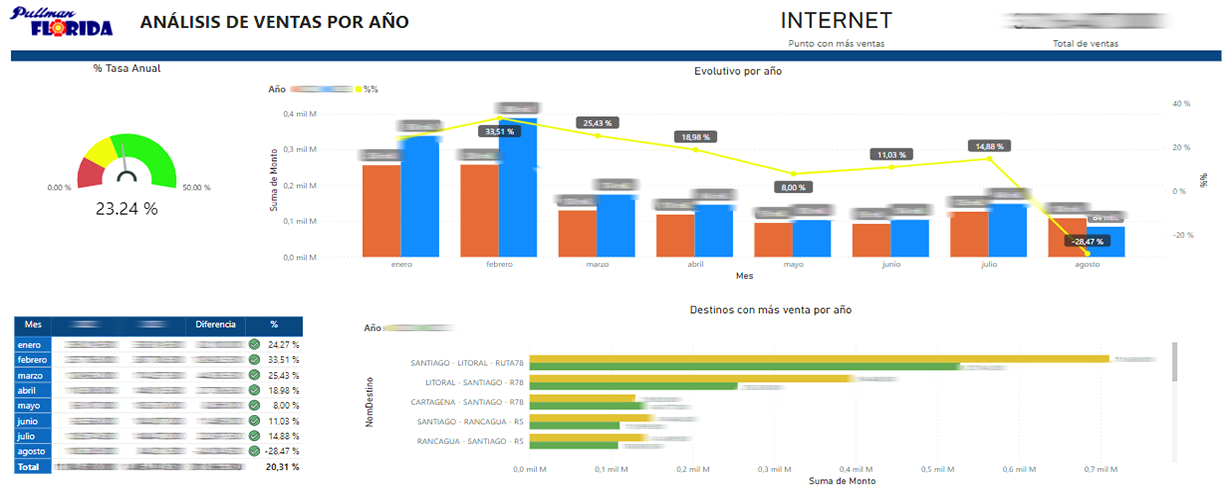
Through the implementation of the ETL (Extract, Transform, Load) process, a comprehensive exploration of the data was achieved, not only opening doors to new perspectives but also marking a milestone in informed decision-making. The starting point of this initiative was the exploration and in-depth analysis of data housed in SQL databases. Through this approach, valuable insights were extracted, providing a solid foundation for the upcoming phases of the project. One of the key achievements in this early stage was the identification of sales patterns and preferred destinations, shedding light on prevailing market trends.
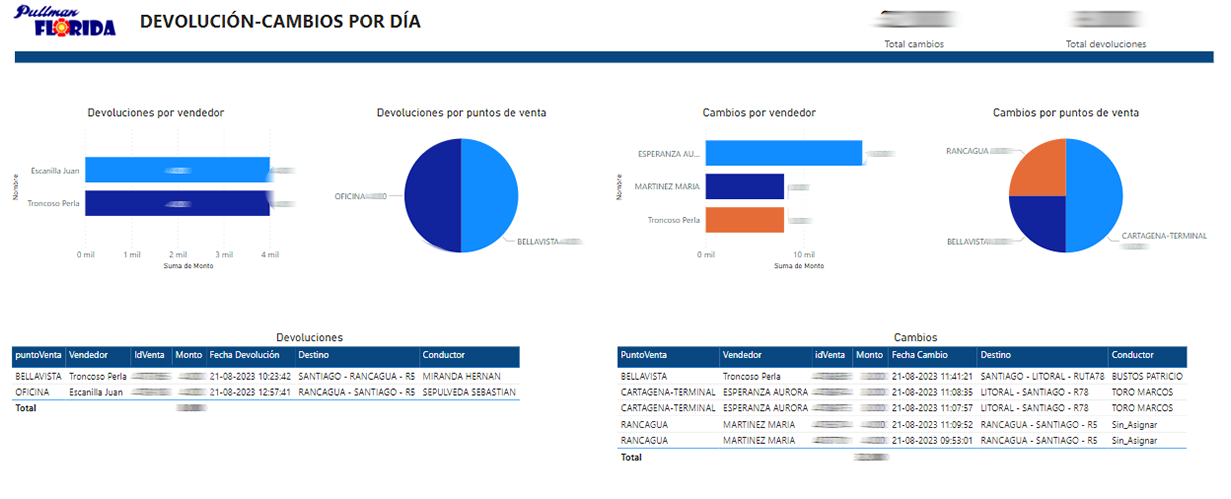
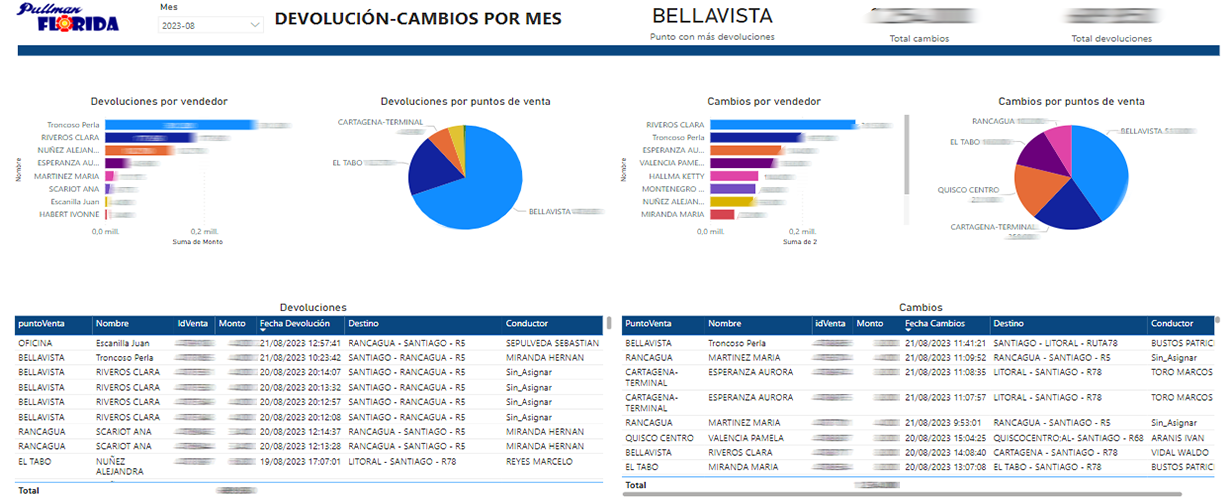
The next stage involved the creation and design of a striking visualization dashboard in Power BI, a platform widely recognized for its ability to transform data into clear and accessible insights. The team of analysts and data visualization experts embarked on the task of graphically representing the findings. This not only facilitated the quick interpretation of the data but also allowed decision-makers to gain relevant real-time insights.
One crucial aspect of the analysis conducted involved evaluating sales and destinations in relation to current and future demand. This phase entailed identifying seasonal patterns and trends, providing crucial information for the planning of future developments.